How we tested ourselves — and what 50 Claude agents found.
The result — and the receipt behind it
Per-dimension lift
Score deltas from the rigor-controlled run (n=30, A/B presentation order randomized per scenario, dual-judge averaged). Every dimension positive, with the largest lift on investigation_quality.
An honest caveat on the sweep. Agent B holds a strict superset of Agent A’s tools, so some reasoning-quality gap is expected by construction — give one agent a research desk and the other only a price chart, and the desk-equipped agent will investigate more. So the 50-0 is not a claim that our signal predicts returns (it doesn’t — no signal applied mechanically beats SPY net of costs). It is the narrower, real claim that a blind judge, not told which agent held which tools, consistently preferred the reasoning the layer enabled — on every dimension, across two separate runs. The dimension that moved most, investigation_quality, is exactly the one you’d expect when the only thing changing is the toolkit.
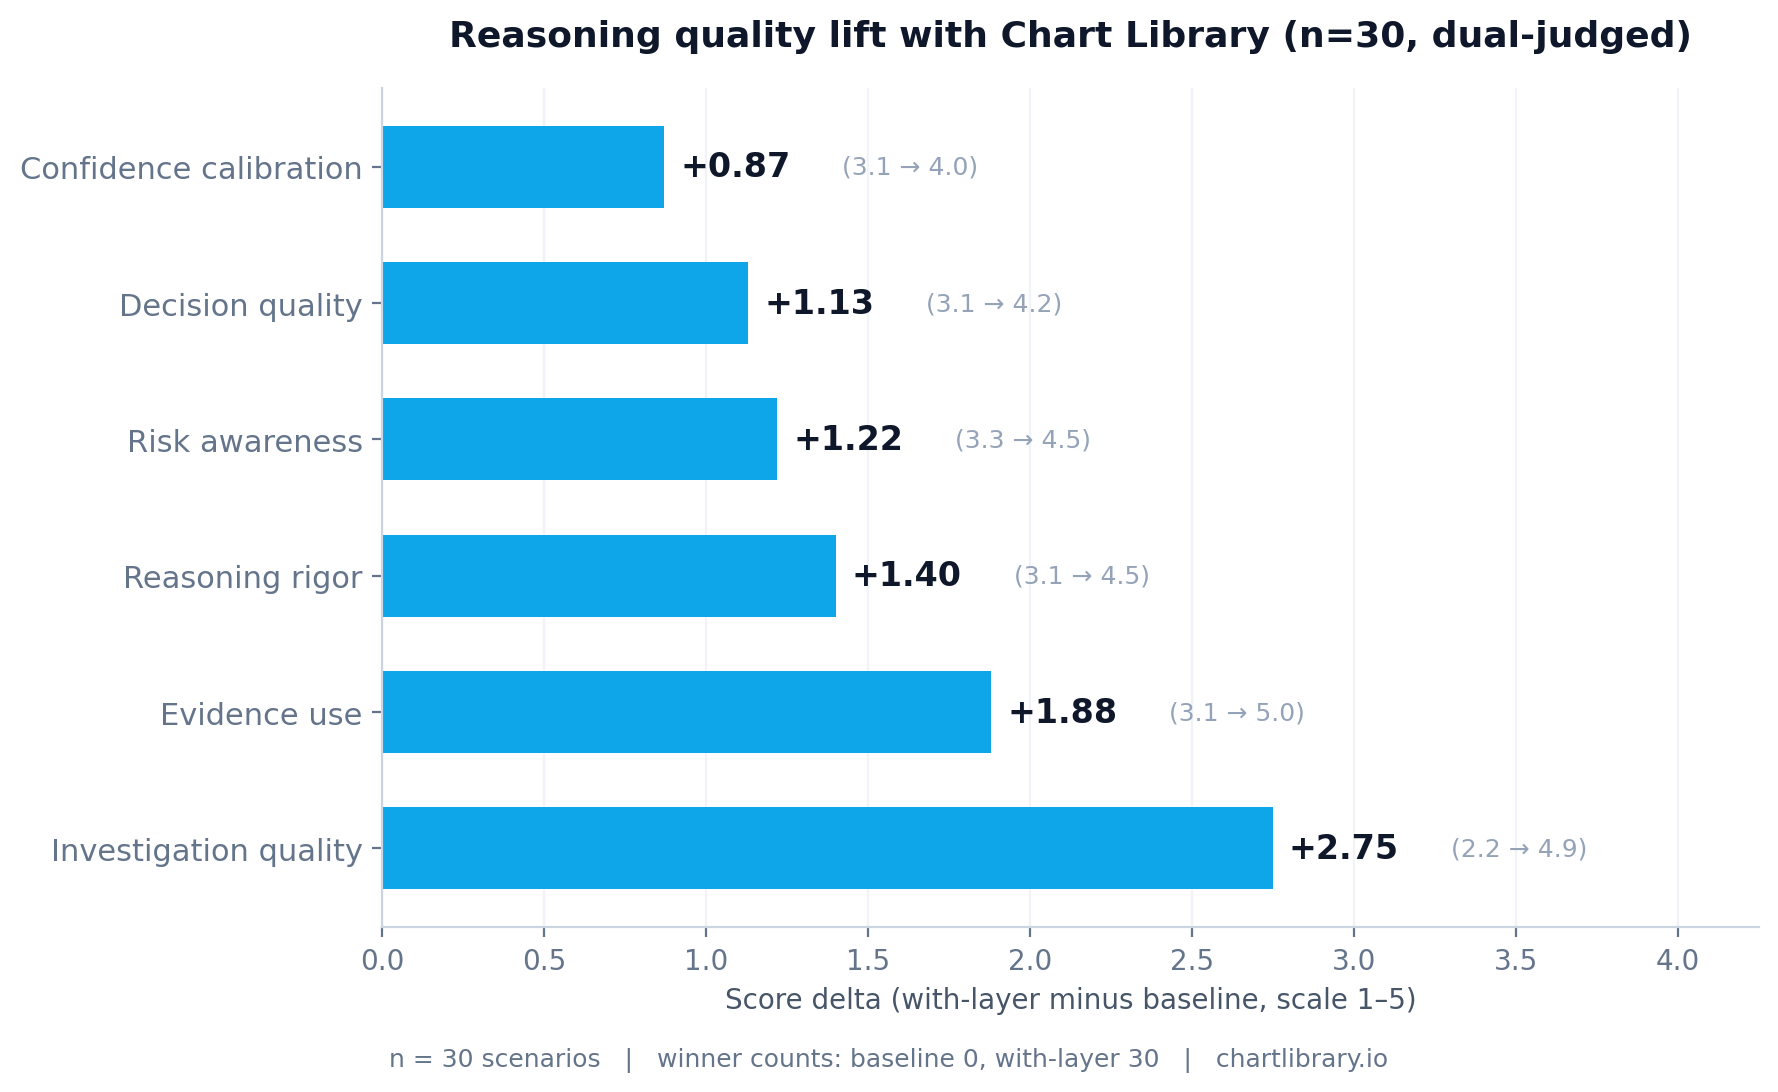
| Dimension | Baseline | With-layer | Δ | paired t |
|---|---|---|---|---|
| Investigation quality | 2.17 | 4.92 | +2.75 | 32.13 |
| Evidence use | 3.07 | 4.95 | +1.88 | 26.66 |
| Reasoning rigor | 3.13 | 4.53 | +1.40 | 18.11 |
| Risk awareness | 3.28 | 4.50 | +1.22 | 13.24 |
| Decision quality | 3.10 | 4.23 | +1.13 | 11.16 |
| Confidence calibration | 3.15 | 4.02 | +0.87 | 12.84 |
The methodology
Two Claude Haiku agents. Identical prompts. Identical out-of-sample scenarios.
- Agent A (baseline): tools for
get_recent_ohlcandget_recent_headlines. Raw data only. - Agent B (with-layer): same plus
cohort_analyze,get_market_context,narrative_pulse. The three intelligence-layer tools. - Scenarios: 50 random (symbol, date) anchors from 2024-onward, balanced across winners, losers, and neutral outcomes.
- Both agents run an Anthropic tool-call loop (max 8 iterations), choosing what to investigate, then output a JSON decision.
- Judge: Claude Sonnet, sees both full traces + final responses, scores each agent on 6 dimensions of reasoning quality. The judge does not know which agent has which toolkit.
- Rigor controls (on the n=30 follow-up): A/B presentation order randomized per scenario; each pair judged twice with swapped order; scores averaged; winner by consensus.
The notable observation: the rigor-controlled run produced larger deltas than the pilot. The controls didn’t expose hidden bias — they revealed that pilot measurement noise had been working slightly against our result, not for it.
The scenario that explains what we actually do — NUVL 2024-09-13
The most revealing scenario in the run involved Nuvalent (NUVL) on September 13, 2024. Both agents were asked: should this be a long entry, 5-day hold?
Both agents reached the same conclusion: no_position. Over the next 5 trading days, NUVL ran +23.5%. Both agents got the outcome wrong.
The judge still ranked Agent B substantially higher. Verbatim:
“Agent B’s investigation was substantially more rigorous, leveraging market context, cohort analytics, and narrative pulse to produce a multi-factor, data-grounded argument, whereas Agent A relied solely on price action from a single tool call and skipped obvious available evidence.”
This is the whole proposition. An intelligence layer doesn’t make your agent right more often. It makes your agent reason better. Sometimes the better-reasoned conclusion is to stay out of a trade that turns out to be a winner. That’s how research works: the realized outcome was the right tail of a distribution; the reasoning that said “stay out” was correct given the available evidence.
The bidirectional value — saves losses, catches winners
Two scenarios in the run showed the agents reaching different decisions. In both, the agent with Chart Library made the better call.
What this means about the product
Most “AI trading” tools promise to predict markets. They mostly don’t work — no signal applied mechanically beats SPY net of costs. Chart Library does something different. We’re not in the prediction business. We’re in the reasoning substrate business.
We give AI agents the kind of structured historical context that lets them think well about uncertain situations — the way a Bloomberg Terminal supports an analyst’s reasoning. The validation that matters for an intelligence layer isn’t whether mechanical use of its outputs produces alpha (almost certainly not). It’s whether agents using it reason better. The evaluation on this page measured exactly that, and the answer was yes, decisively.
Try the intelligence layer that won 50–0.
Same engine, same tools the agents used. Free sandbox tier — 200 calls/day, no card required.